
The national gross return on a fix-and-flip fell to 25.1% in Q2 2025, the lowest since 2008, according to ATTOM Data Solutions. At the same time, 71% of active flippers surveyed by JBREC and Kiavi expect to purchase more properties in 2026 than they did in 2025, the highest share in the survey's four-year history.
Those two data points are not contradictory. Margins have compressed. Activity is accelerating. What has changed is who is succeeding, and why.
The investors and lenders getting it right in this environment are not relying on a rising tide to lift their returns. They are underwriting more carefully, structuring deals with more precision, and understanding the mechanics of fix-and-flip financing at a level that separates disciplined operators from optimistic ones.
This guide covers how fix-and-flip loans work, how private lenders structure and underwrite them, and what both lenders and borrowers need to understand to operate successfully in today's market.
What Is a Fix-and-Flip Loan?
A fix-and-flip loan is a short-term, asset-based loan designed to finance the purchase and renovation of a distressed property with the intent to resell it at a profit. Unlike a conventional mortgage, which is structured for long-term ownership and underwritten primarily on the borrower's income, a fix-and-flip loan is underwritten on the deal itself: the property's current condition, the planned renovation, and the estimated value of the finished product.
These loans go by several names in the market: hard money loans, bridge loans, and residential transition loans (RTLs) are all used interchangeably, depending on the lender and context. The mechanics are the same. The lender provides capital for acquisition and renovation. The borrower completes the project and exits either by selling the property or refinancing into a longer-term product. The loan term is typically 6 to 18 months.
The structural difference from conventional financing is important. A traditional lender asks: can this borrower service this debt over the next 30 years? A fix-and-flip lender asks: does this deal make sense? If the project executes as planned, is there enough margin to cover the loan and generate a return? The underwriting framework shifts from borrower creditworthiness to deal quality, which is why private lenders can close faster and on properties that conventional lenders will not touch.
How Fix-and-Flip Loans Are Structured
Every fix-and-flip loan has two components: the initial advance and the construction holdback.
The initial advance is the portion of the loan that funds the purchase. It is wired to the title company at closing and covers some or all of the acquisition cost, depending on the leverage the lender is willing to extend. The construction holdback is the portion allocated to renovation. It is not released at closing. Instead, the lender disburses it in stages as work is completed, verified through inspections or draw requests submitted by the borrower.
This structure protects the lender. By releasing renovation funds incrementally rather than all at once, the lender maintains control over the collateral value at each stage of the project. A borrower who abandons a project midway through construction does not walk away with the full renovation budget in hand.
The Three Ratios That Control Leverage
Fix-and-flip lenders use three metrics to determine how much they will lend on a given deal. Most lenders calculate all three and use the most conservative result.
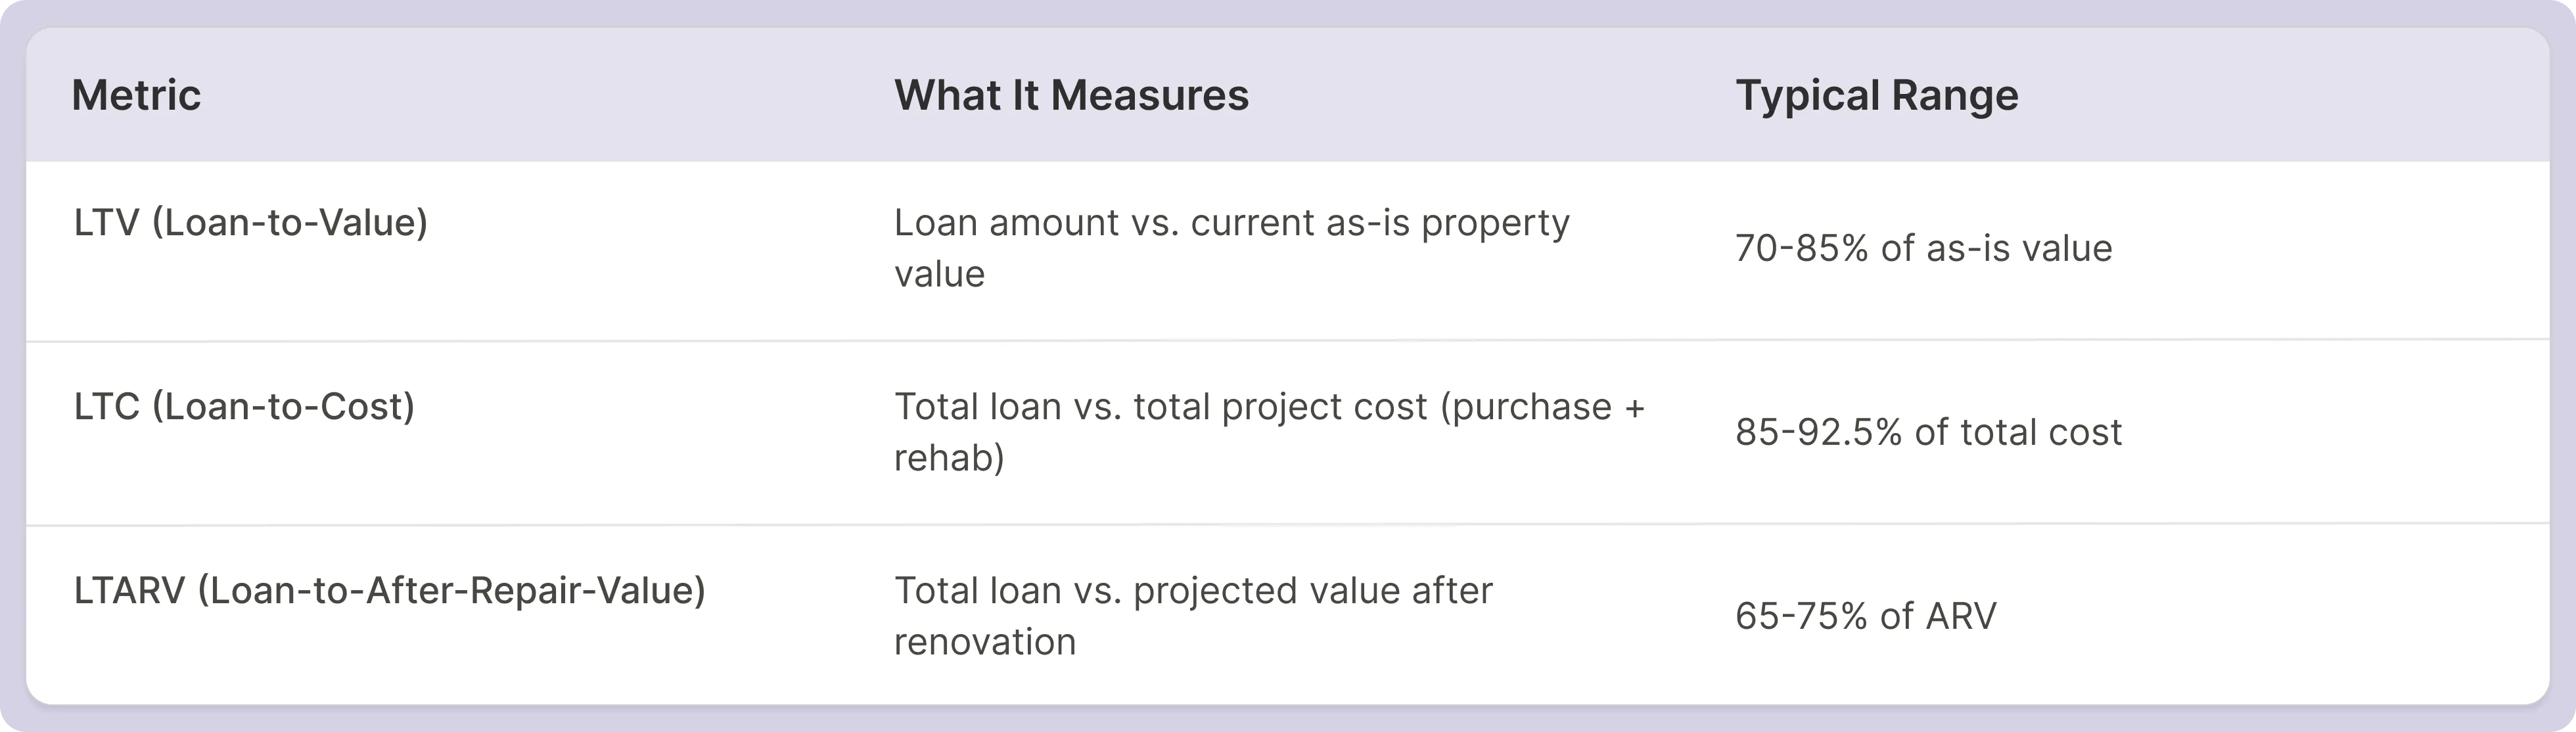
Understanding how these three ratios interact is essential. A lender might advertise 90% LTC financing, but if that total loan amount exceeds 70% of the ARV, the LTARV cap controls. The ARV cap is the ultimate guardrail, because it ensures the lender's exposure stays within a range that the completed project can support.
A Worked Example
Purchase price: $200,000. Rehab budget: $60,000. Total project cost: $260,000. Estimated ARV: $370,000.
- LTC at 90%: $260,000 x 0.90 = $234,000
- LTARV at 70%: $370,000 x 0.70 = $259,000
- The LTC cap controls: maximum loan is $234,000
In this scenario, the lender finances $234,000 of a $260,000 project. The borrower brings $26,000 to closing, plus reserves. If the ARV estimate proves accurate and the project executes on budget, the borrower exits at $370,000, repays the loan, and captures the margin.
What Private Lenders Evaluate When Underwriting a Fix-and-Flip
Fix-and-flip underwriting has three pillars: the deal, the borrower, and the exit.
The Deal
ARV is the most important number in fix-and-flip underwriting, and it is also the number most frequently abused. ARV is a projection, not a fact. A lender's job is to stress-test that projection against comparable sales, current market conditions, and the realism of the renovation scope.
A well-supported ARV is grounded in recent closed sales of renovated comparable properties within a tight radius. It accounts for days-on-market trends and local absorption rates. It does not assume the best-case scenario.
Alongside ARV, lenders evaluate the as-is value (the property's current market worth before renovation), the renovation scope and budget (is the plan executable at the proposed cost?), and the spread between total project cost and ARV. A thin spread means a thin margin for error. Small cost overruns or a softening resale market can eliminate the borrower's equity entirely.
The Borrower
Fix-and-flip lenders are primarily deal-focused, but borrower profile still matters. The key variables are experience, liquidity, and credit.
Experience is assessed by track record: completed projects of similar scope, within a defined lookback period (typically 24 to 36 months). A borrower with 10 completed flips is a fundamentally different credit profile than a first-time investor, even if the deal looks identical on paper. Most lenders tier their leverage and pricing by experience level. First-time investors generally access lower LTCs and pay higher rates. Experienced operators get better terms.
Liquidity matters because projects do not always execute on budget or on timeline. Lenders require minimum reserves at closing and post-close, not as a formality, but because a borrower who runs out of cash mid-renovation is the lender's problem. FICO minimums typically sit around 660 to 680, with better terms available above 720.
The Exit
Every fix-and-flip loan needs a defined exit strategy. The two options are resale and refinance.
Resale is the default. The borrower completes the renovation, lists the property, and repays the loan from sale proceeds. The lender's evaluation of this exit centers on whether the local market will absorb the finished product at the projected price, within the loan term.
Refinance is the alternative. The borrower completes the renovation, stabilizes the property as a rental, and refinances into a DSCR loan. This bridge-to-DSCR strategy has become increasingly common as resale margins have compressed. It gives the borrower a fallback when the flip thesis does not pencil at current conditions. Lenders who offer both fix-and-flip financing and DSCR products are positioned to serve both legs of this strategy.
Fix-and-Flip Loan Rates, Terms, and Fees in 2026
Rate expectations have reset. Average fix-and-flip loan rates fell from approximately 11.1% in September 2024 to 10.43% in September 2025, according to Stormfield Capital, with most borrowers in the 9% to 12% range entering 2026. Some disciplined institutional lenders offer rates starting near 9.99%. Rates above 12% typically reflect first-time borrowers, higher-risk markets, or properties with significant project complexity.
Points at origination typically range from 1 to 3, depending on the lender, loan size, and borrower profile. Repeat borrowers at established lender relationships often negotiate reduced points over time.
Loan terms run 6 to 18 months, with 12 months being the most common. Some lenders offer extensions for projects running behind schedule, usually for a fee. Prepayment penalties are rare in fix-and-flip lending, given that early payoff through a fast sale is the ideal outcome for both parties.
Fix-and-Flip vs. Bridge Loans vs. DSCR Loans: How They Fit Together
These three loan types are often confused. The distinctions matter operationally.
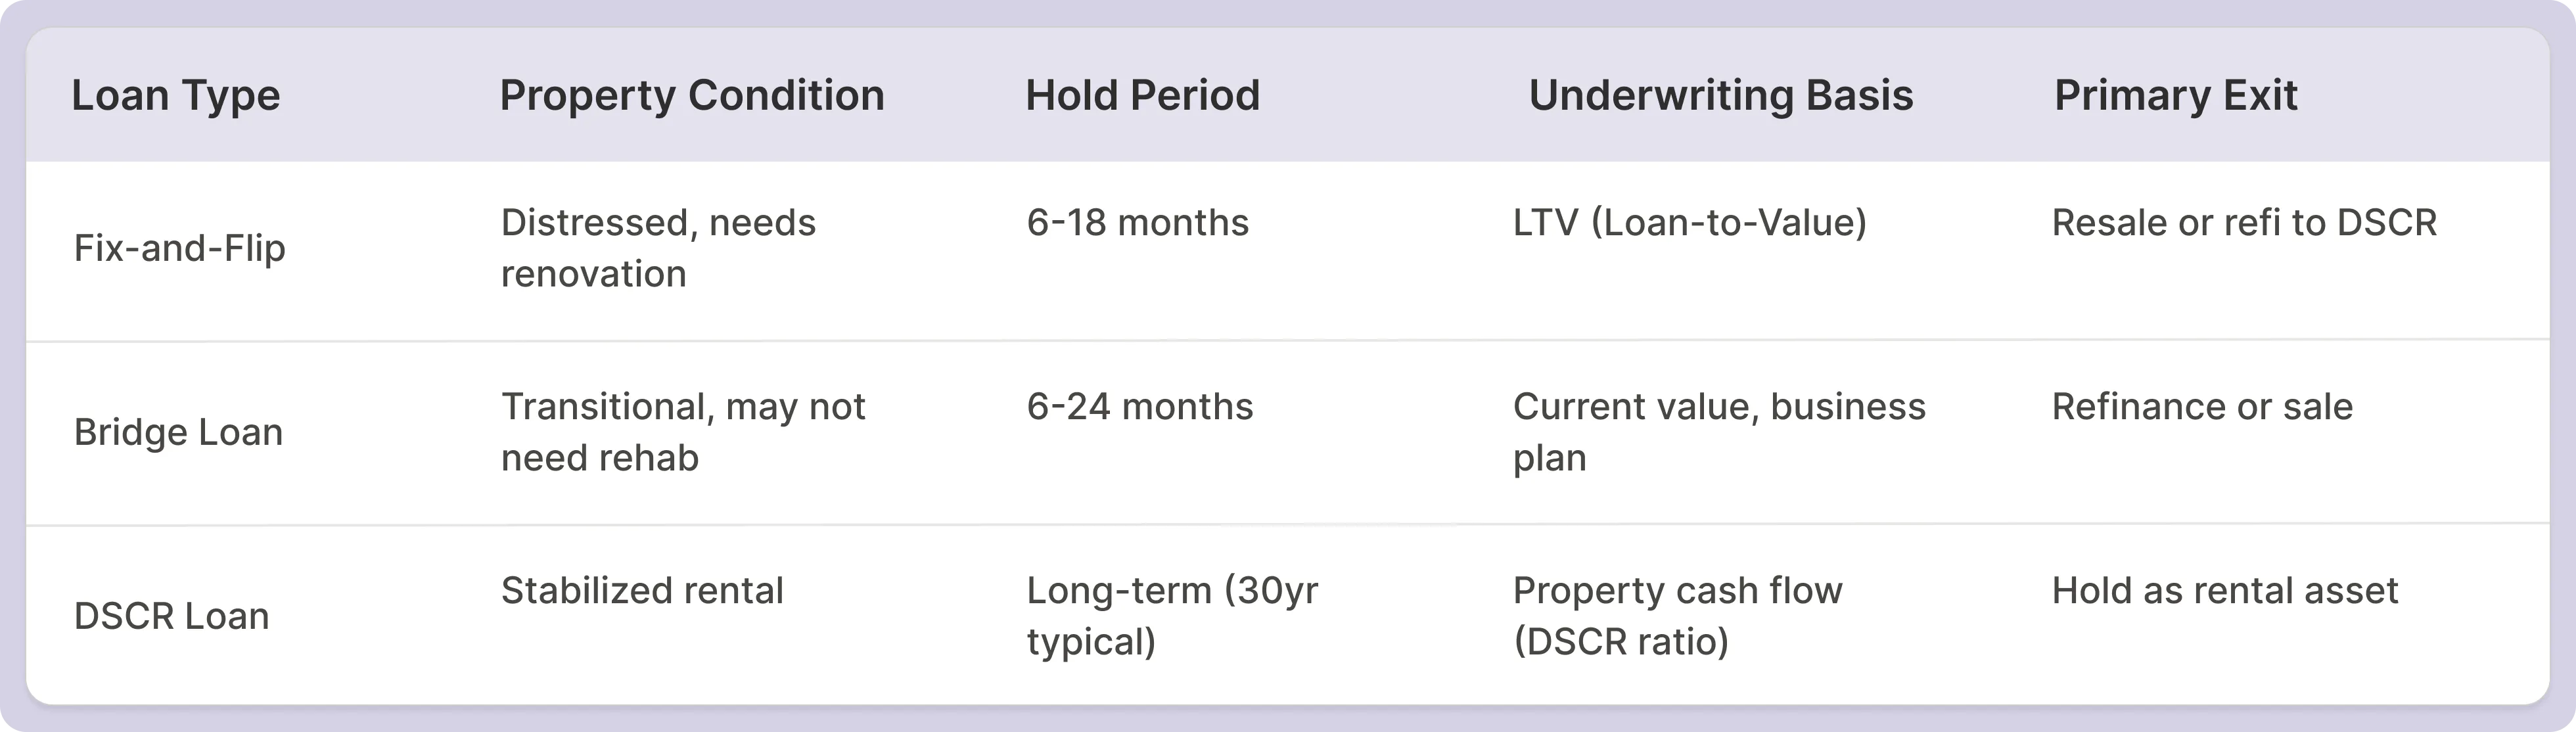
The bridge-to-DSCR strategy is worth understanding in depth, because it has become a meaningful part of how sophisticated investors operate in a compressed-margin environment. The investor acquires and renovates using fix-and-flip financing. If the resale market is unfavorable at project completion, the investor transitions to a rental and refinances into a DSCR loan instead. The fix-and-flip lender who also offers DSCR products captures both originations. The lender who only does fix-and-flip sends the borrower elsewhere for the second transaction.
The Fix-and-Flip Market in 2026: What Lenders Need to Know
The national picture is complicated. Gross ROI on fix-and-flip projects fell to approximately 23% in Q3 2025, a 17-year low, according to ATTOM. But the national average obscures enormous geographic variation.
Pittsburgh posted gross ROI above 107% in Q2 2025. Buffalo exceeded 109%. Cleveland jumped from 39% to 72% gross ROI in a single year. These markets share a common structure: low acquisition prices, stable employment anchors, and constrained new construction that keeps resale inventory tight.
Meanwhile, markets with elevated inventory growth, particularly Florida and Texas, are presenting meaningfully higher exit risk for flippers. In markets where both new and resale inventory grew significantly through 2025, flippers are cutting prices or extending holds to achieve sales. For RTL lenders, this translates to higher risk of loss. Geographic exposure in these regions deserves close scrutiny in portfolio review.
The forward outlook heading into 2026 is cautiously positive. The Fix and Flip Market Index posted its largest quarterly gain in three years in Q4 2025. Three tailwinds are driving the improvement: price stabilization in most major metros, lower financing costs following rate declines since mid-2024, and new tax incentives under the 2025 One Big Beautiful Bill, including enhanced depreciation and deductible interest expenses on fix-and-flip loans.
For lenders, rising borrower demand is an origination opportunity. For lenders with undisciplined underwriting, it is also a portfolio risk. The difference between a good vintage and a bad one in fix-and-flip lending often comes down to ARV discipline and geographic exposure management.
How Private Lenders Manage Risk in Fix-and-Flip Portfolios
Fix-and-flip lending involves real risk. The loan is secured by a property that, at origination, is often worth less than the loan amount once renovation costs are factored in. The collateral reaches full value only after the project is complete. Managing that gap is the core risk discipline of the asset class.
Conservative ARV Estimation
The most consequential risk decision a fix-and-flip lender makes is approving the ARV. Overestimated ARVs are the single most common source of loss in this asset class. The lender's review process should include comparable selection criteria (distance, recency, condition match), confidence thresholds that trigger full appraisal rather than BPO or AVM, and stress-testing the ARV against a 5% to 10% downside scenario.
Draw Management as a Risk Control
Construction holdback disbursement is not just a bookkeeping function. It is a risk control mechanism. Releasing renovation funds in tranches tied to completed and inspected work limits the lender's exposure at any given point in the project. A well-run draw process catches scope creep, budget overruns, and contractor problems before they become loan problems.
Virtual inspection workflows, increasingly standard in the market, have made draw management faster without sacrificing oversight. Lenders who can complete draw reviews in 24 to 48 hours provide a material operational advantage to borrowers managing active renovation timelines.
Borrower Experience Tiering
Structuring leverage limits by borrower experience is not a courtesy to experienced investors. It is a risk management discipline. A first-time flipper operating at 90% LTC on a $400,000 project has almost no margin for error. A single contractor delay or unexpected structural issue eliminates their equity. The lender carries that exposure.
Most lenders that operate well in this space have documented experience tiers: how many completed projects, within what timeframe, at what scope, translate to what leverage allowance. The criteria are explicit, consistently applied, and revisited as market conditions change.
Frequently Asked Questions
What is the difference between LTV and LTC in fix-and-flip lending?
LTV (loan-to-value) measures the loan amount against the property's current as-is value. LTC (loan-to-cost) measures the total loan against the total project cost, including purchase price and renovation budget. Fix-and-flip lenders calculate both, along with LTARV (loan-to-after-repair-value), and apply the most conservative result to set the maximum loan amount.
Can first-time investors qualify for fix-and-flip loans?
Yes, though terms are typically more conservative. First-time borrowers generally access lower LTCs, pay higher rates, and face tighter scrutiny on the deal quality and renovation plan. Lenders compensate for the lack of track record by requiring stronger deal fundamentals and higher liquidity. A first-time investor with a well-structured deal, strong credit, and adequate reserves can get funded, though not at the same terms as an experienced operator.
How is ARV determined, and who calculates it?
ARV is estimated based on comparable sales of renovated properties in the same area. Lenders use broker price opinions (BPOs), independent appraisals, or automated valuation models (AVMs) depending on the loan size, property type, and their own underwriting standards. For larger or more complex deals, most lenders require a full appraisal with ARV-focused comparable selection. The lender controls the ARV determination, not the borrower.
What does a typical draw schedule look like?
Draw schedules vary by lender and project scope, but the standard structure ties disbursements to defined renovation milestones: rough framing, mechanical systems, drywall, finish work, and final completion. The borrower submits a draw request with documentation of completed work, the lender inspects (in-person or virtually), and funds are released within a defined window, typically 24 to 72 hours. Draws are reimbursements, not advances, meaning work must be completed before funding.
How quickly can a fix-and-flip loan close?
Private lenders can typically close in 7 to 14 business days when documentation is complete. Some lenders close in as few as 5 to 7 days on straightforward deals with experienced borrowers. The main variables are appraisal timing (for deals requiring a full ARV appraisal), title work, and documentation completeness. Lenders that have a clean underwriting process and an organized borrower can move significantly faster than this range.
How Baseline Supports Fix-and-Flip Lenders
Fix-and-flip lending is operationally intensive. Draw management, loan lifecycle tracking, borrower communication, and construction documentation all happen in parallel, across multiple active projects simultaneously. The lenders who scale in this asset class are the ones who have the operational infrastructure to handle volume without adding proportional headcount.
Baseline is built for private lenders who originate fix-and-flip loans at scale. The platform handles the full loan lifecycle from origination through payoff, with native draw management, digital borrower portals for self-service draw requests, and reporting that gives lenders real-time visibility across their portfolio.
See how Baseline works for fix-and-flip lenders at baselinesoftware.com/contact-us